Observability as a Service
Treblle’s observability as a service lets you directly integrate real-time API request visibility into your developer portal.
Developers can inspect requests, filter logs, and troubleshoot integration issues without checking Treblle’s platform. They can see customer requests directly within their developer portal.
Steps to Embed Observability as a Service
Section titled “Steps to Embed Observability as a Service”Adding the Observability Script
Section titled “Adding the Observability Script”First, you need to include the Treblle observability script in the <head> section of your HTML file:
<script src="https://assets.treblle.com/oaas-v8.min.js"></script>Embedding Treblle’s Observability Logs
Section titled “Embedding Treblle’s Observability Logs”Once you decide where to display API request logs, Insert the following <div> element:
For the dark theme:
<div class="treblle-embeded-logs dark-theme" data-project="YOUR_PROJECT_ID" data-customer="YOUR_CUSTOMER_ID">For the default theme:
<div class="treblle-embeded-logs" data-projects="YOUR_PROJECT_ID" data-customers="YOUR_CUSTOMER_ID"></div>Replace YOUR_PROJECT_ID with your Treblle API ID (found under the API Settings).
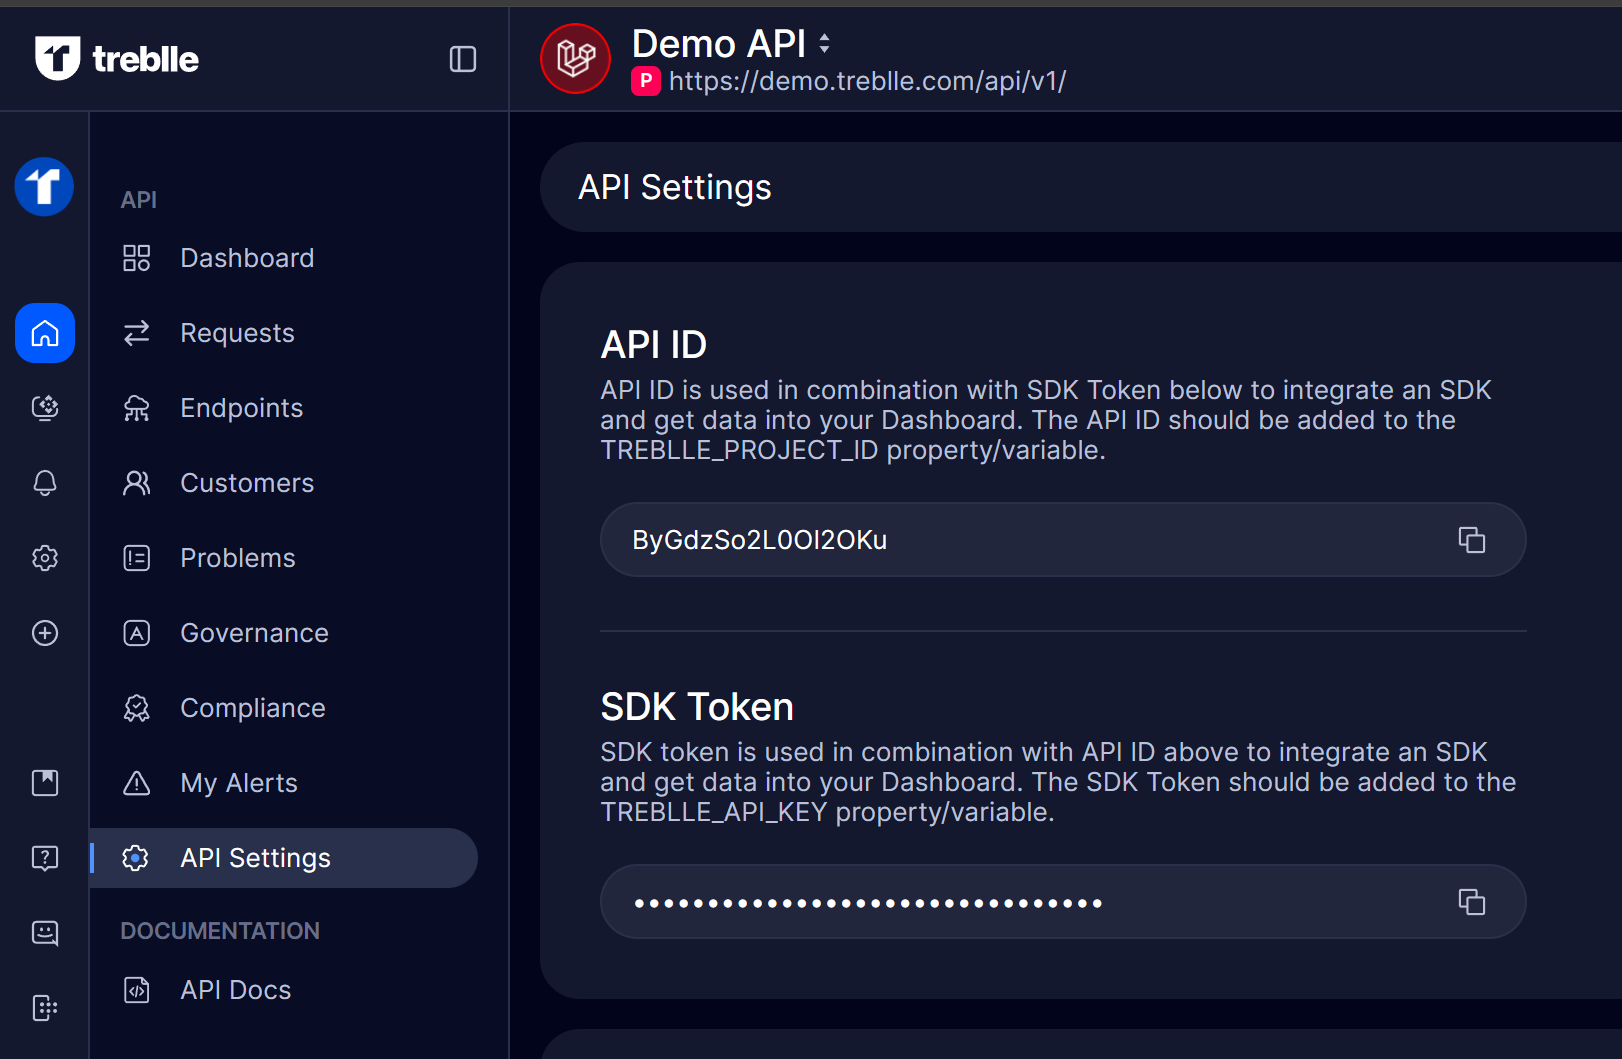
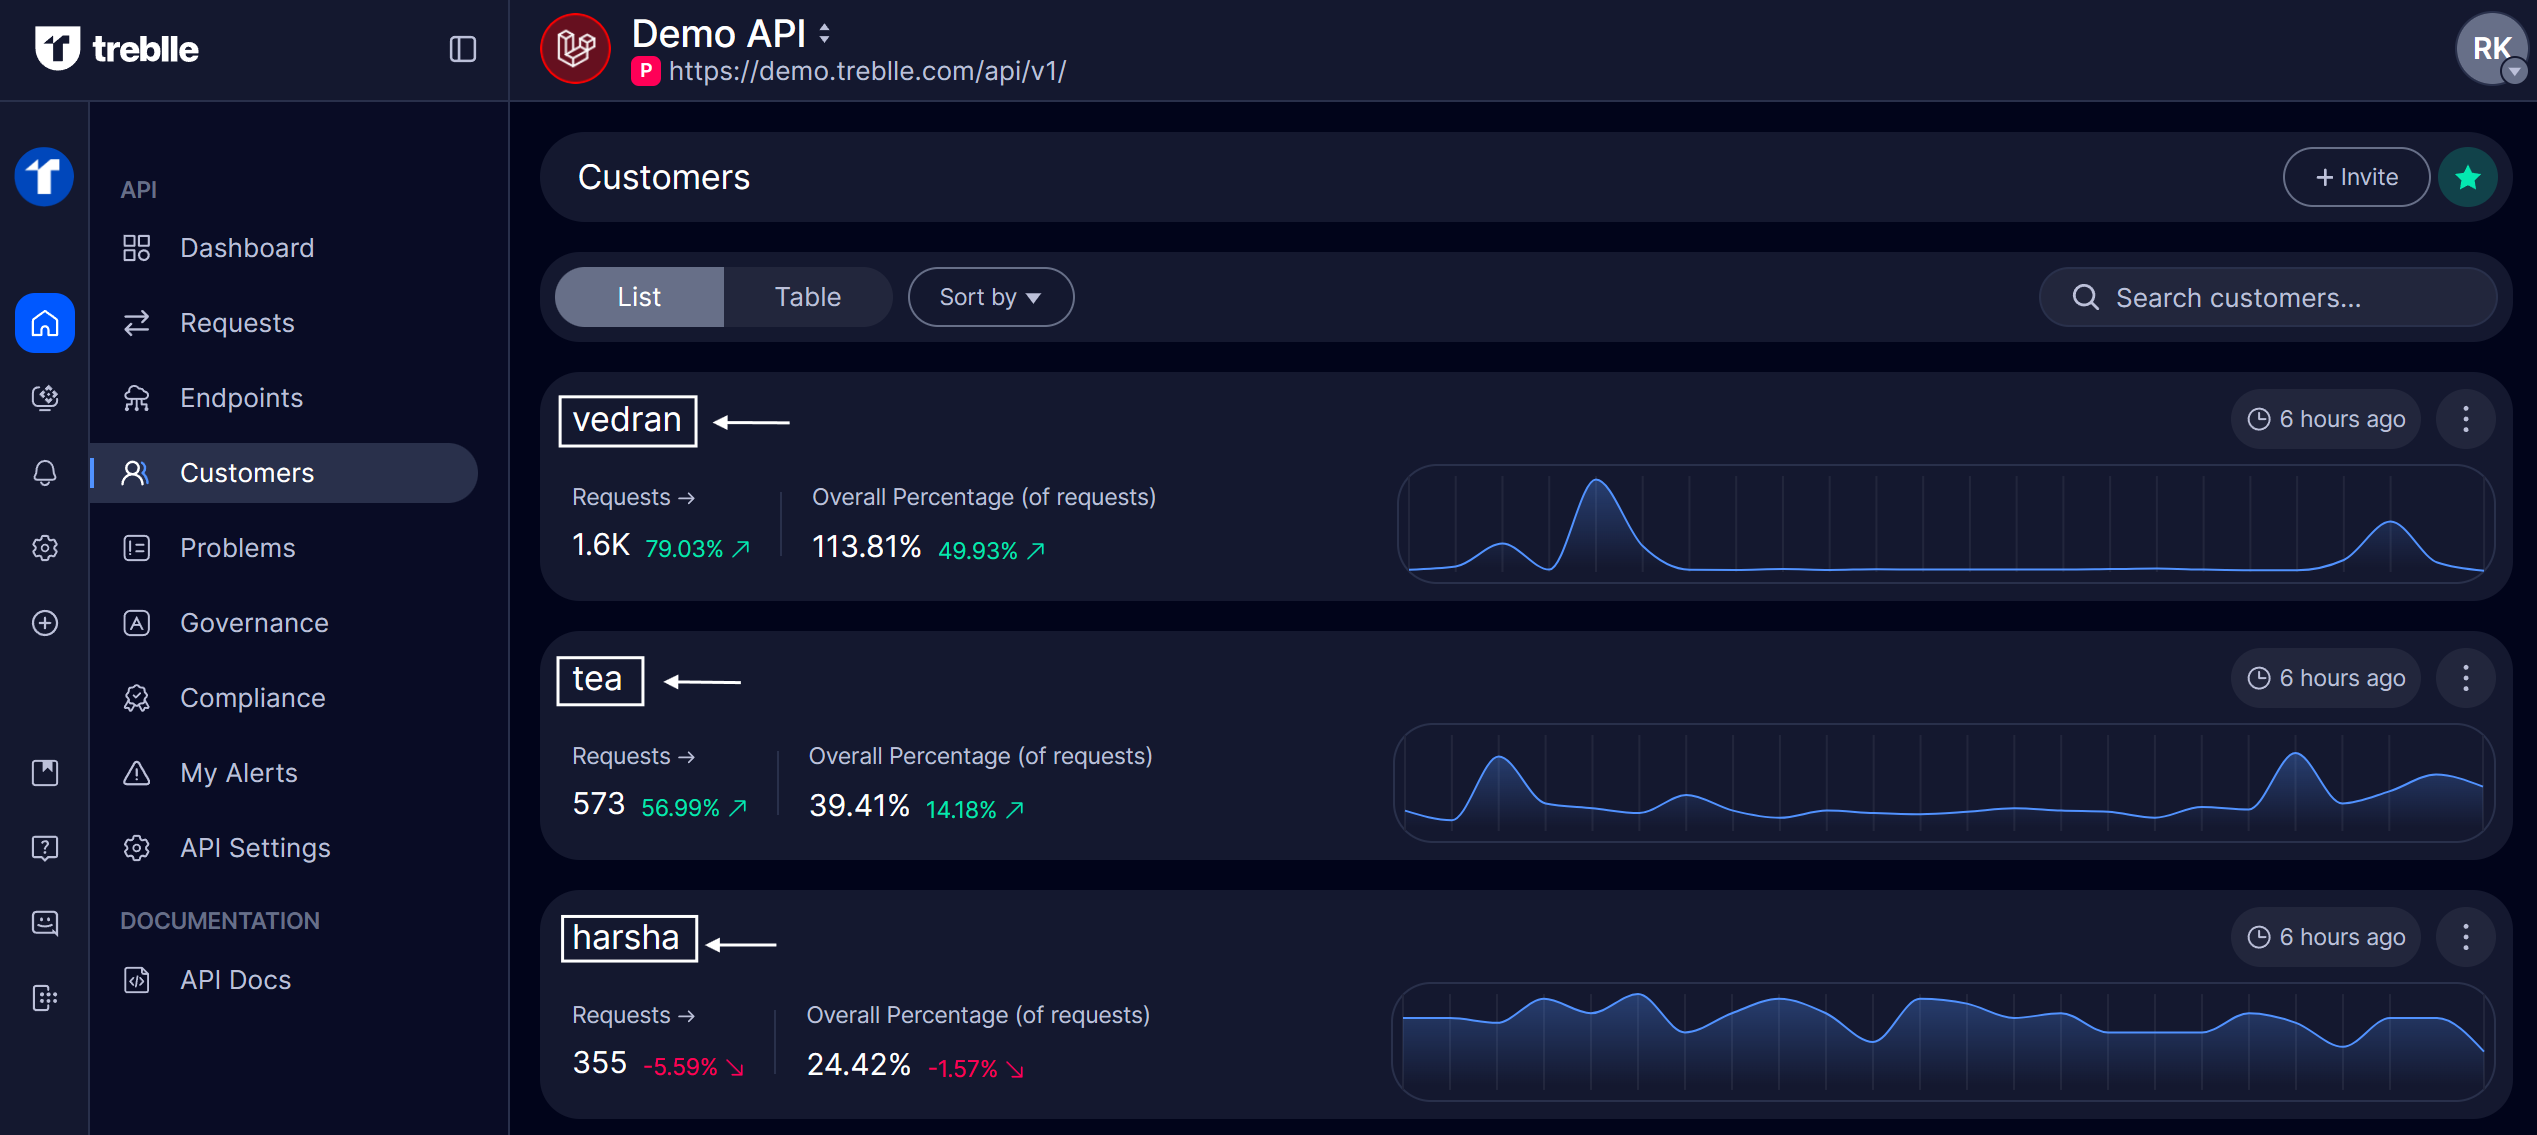
Also, replace YOUR_CUSTOMER_ID with the customer name (found under the Customer section).
Save and Refresh
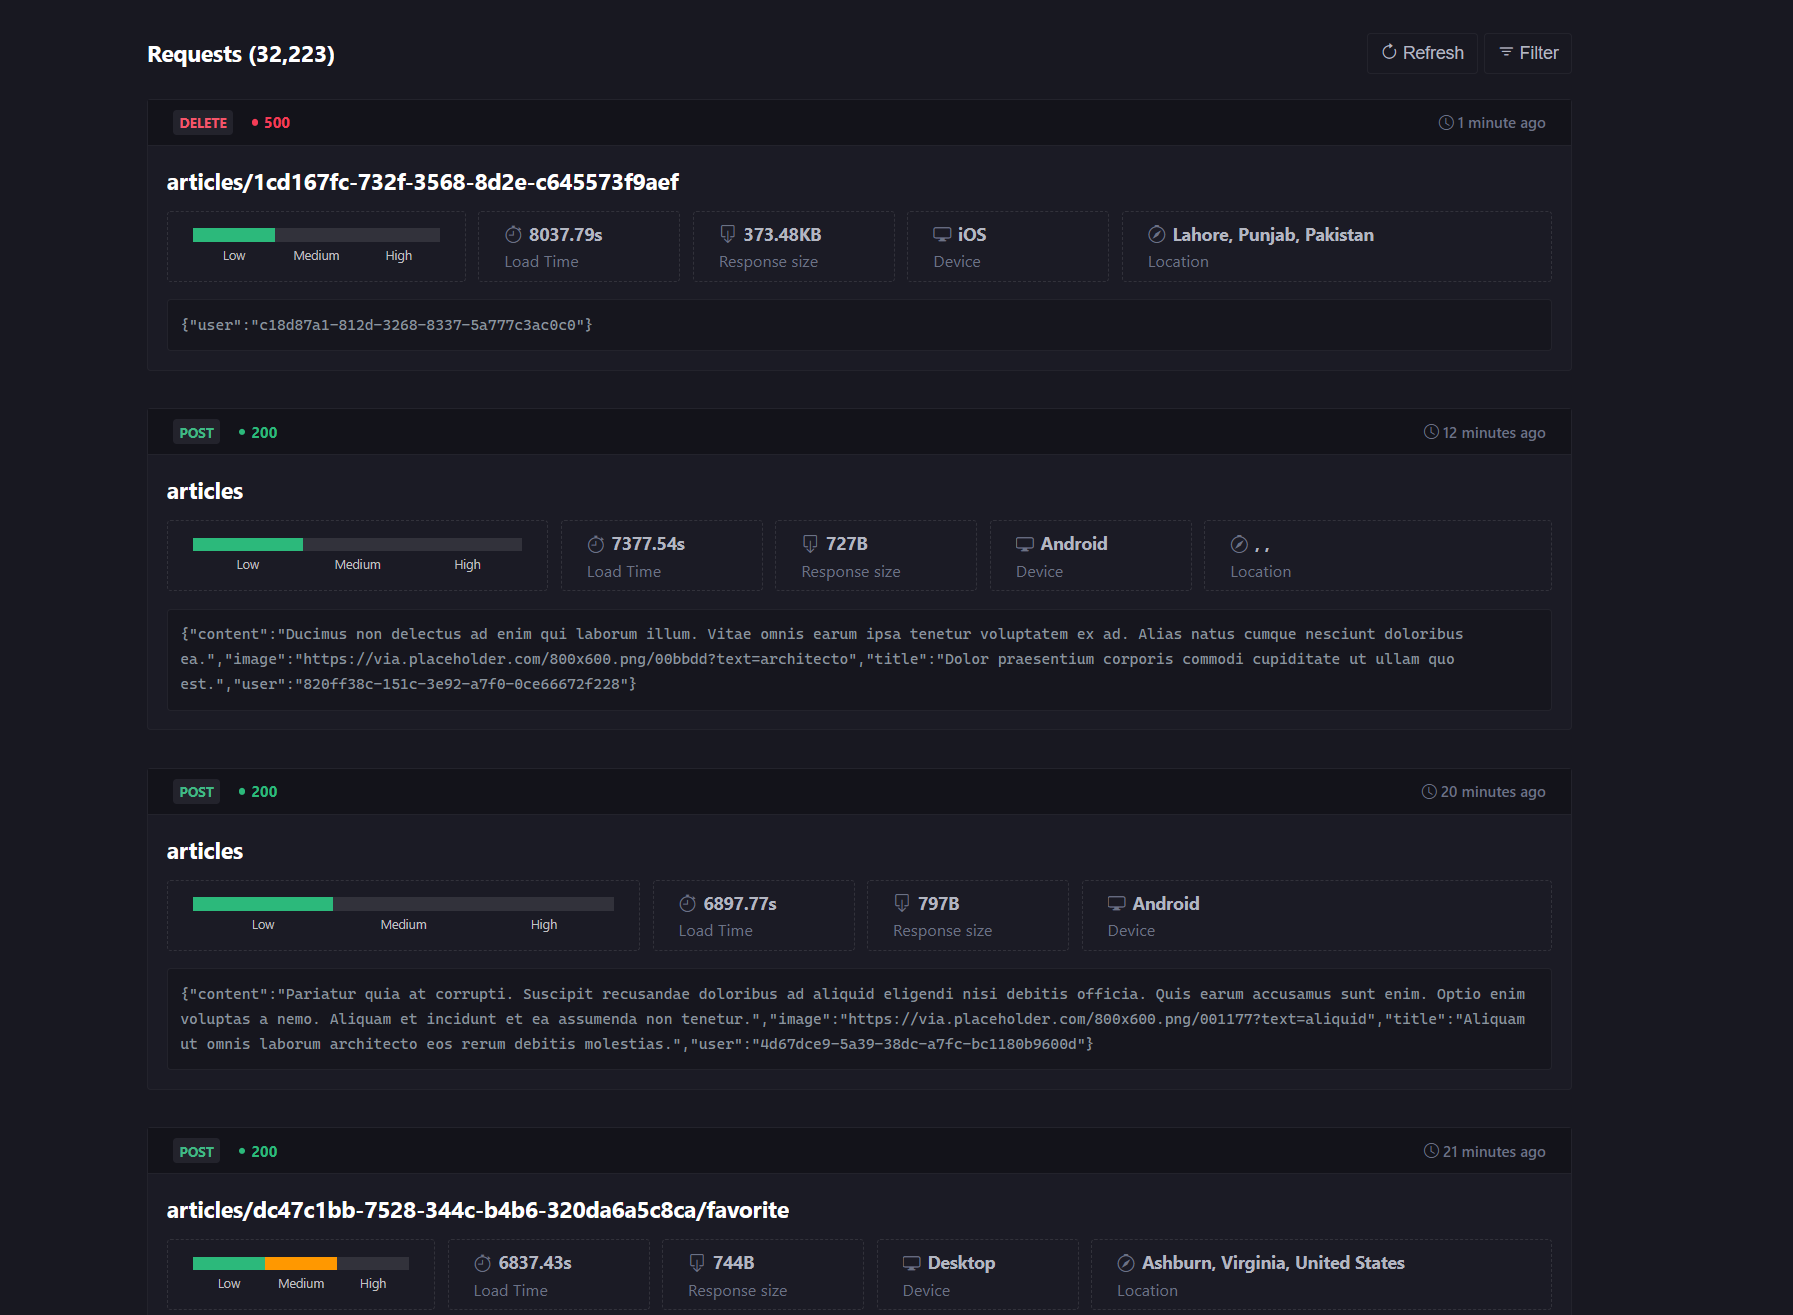
Section titled “Save and Refresh”After adding the script and <div>, save your changes and reload the portal. You should now see a real-time API request log section.
Running Treblle’s DEMO API
Section titled “Running Treblle’s DEMO API”The code below is an example of Treblle’s DEMO API. You can use it and run it directly on your IDE to see how it works in real time. Since this is a demo, you can use the same project ID and customer ID without any modifications.
<!DOCTYPE html><html lang="en">
<head>    <meta charset="utf-8" />    <meta http-equiv="X-UA-Compatible" content="IE=edge" />    <meta name="viewport" content="width=device-width, initial-scale=1, shrink-to-fit=no" />    <meta name="description" content="Observability As A Service - Treblle" />    <meta name="author" content="Treblle" />    <title>Observability As A Service - Treblle</title></head>
<body style="background-color: #181821; /*background-color: #181821;*/">    <div style="margin: 0 auto; max-width: 1140px; width: 100%">        <div class="treblle-embeded-logs dark-theme" data-project="ByGdzSo2L0OI2OKu" data-customer="vedran">        </div>    </div>
    <script src="https://assets.treblle.com/oaas-v8.min.js"></script></body>
</html>
After running the code in your IDE, start a local web server (e.g., serve .) to view the embedded observability in your portal.
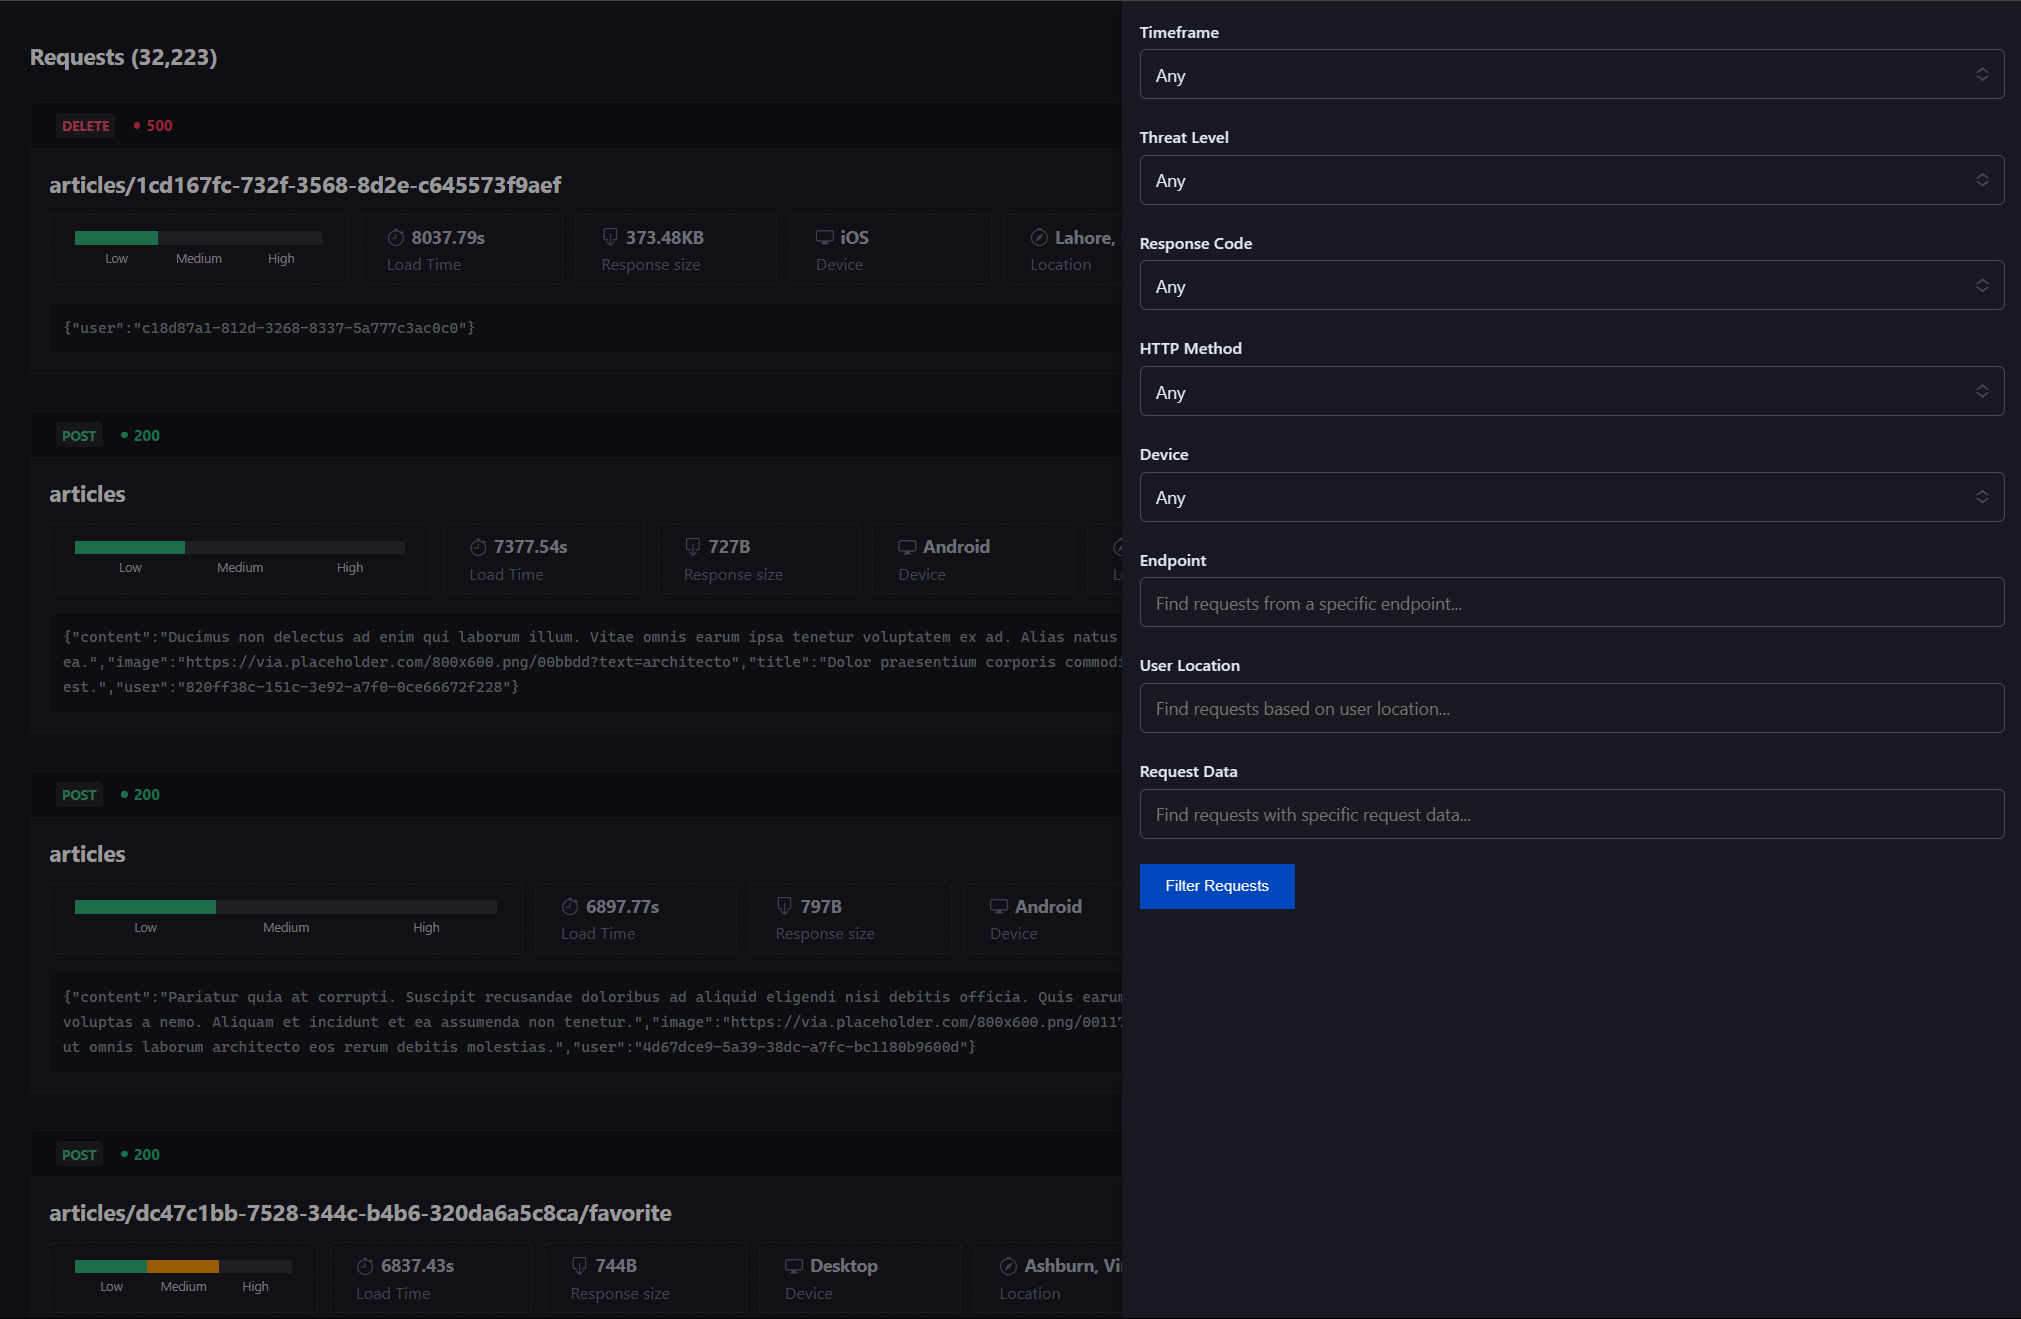
Filtering API Requests
Section titled “Filtering API Requests”-
Timeframe – Filter and view API requests based on a specific date and time range.
-
Threat Level – Identify and filter requests based on security risk levels (high, medium, low).
-
Response Code – Sort requests by HTTP status codes like 200, 400, or 500.
-
HTTP Method – Filter requests by method type, such as GET, POST, or DELETE.
-
Device – See API requests grouped by device type (mobile, desktop, IOS, etc.).
-
Endpoint – Filter and focus on requests made to a specific API route or path to analyze traffic and performance for particular endpoints.
-
User Location – Track and filter requests based on the user’s location.
-
Request Data – Inspect request payloads, headers, and query parameters.
The Observability as a Service lets you integrate real-time API request visibility into your developer portal. This setup allows you to view and troubleshoot customer requests directly in your portal without needing to access Treblle’s platform.