Security Dashboard
Treblle’s Security Dashboard provides a unified security view across your entire API landscape, helping you maintain clean APIs and satisfy auditor requirements.
This workspace-level dashboard enables you to detect vulnerabilities, monitor authentication health, and visualize security metrics at scale.
What is the Security Dashboard?
Section titled “What is the Security Dashboard?”The Security Dashboard is a comprehensive security monitoring tool built for your complete API portfolio. It provides:
- Authentication Analysis: Detect APIs with weak or missing authentication
- Zombie Endpoint Detection: Identify unused or inactive endpoints
- Security Risk Visualization: View security metrics by API type, authentication method, BOLA, BFLA, and more
- Real-time Monitoring: Track security issues across all workspace APIs
- Customizable Widgets: Focus on security metrics that matter most to your organization
Accessing the Security Dashboard
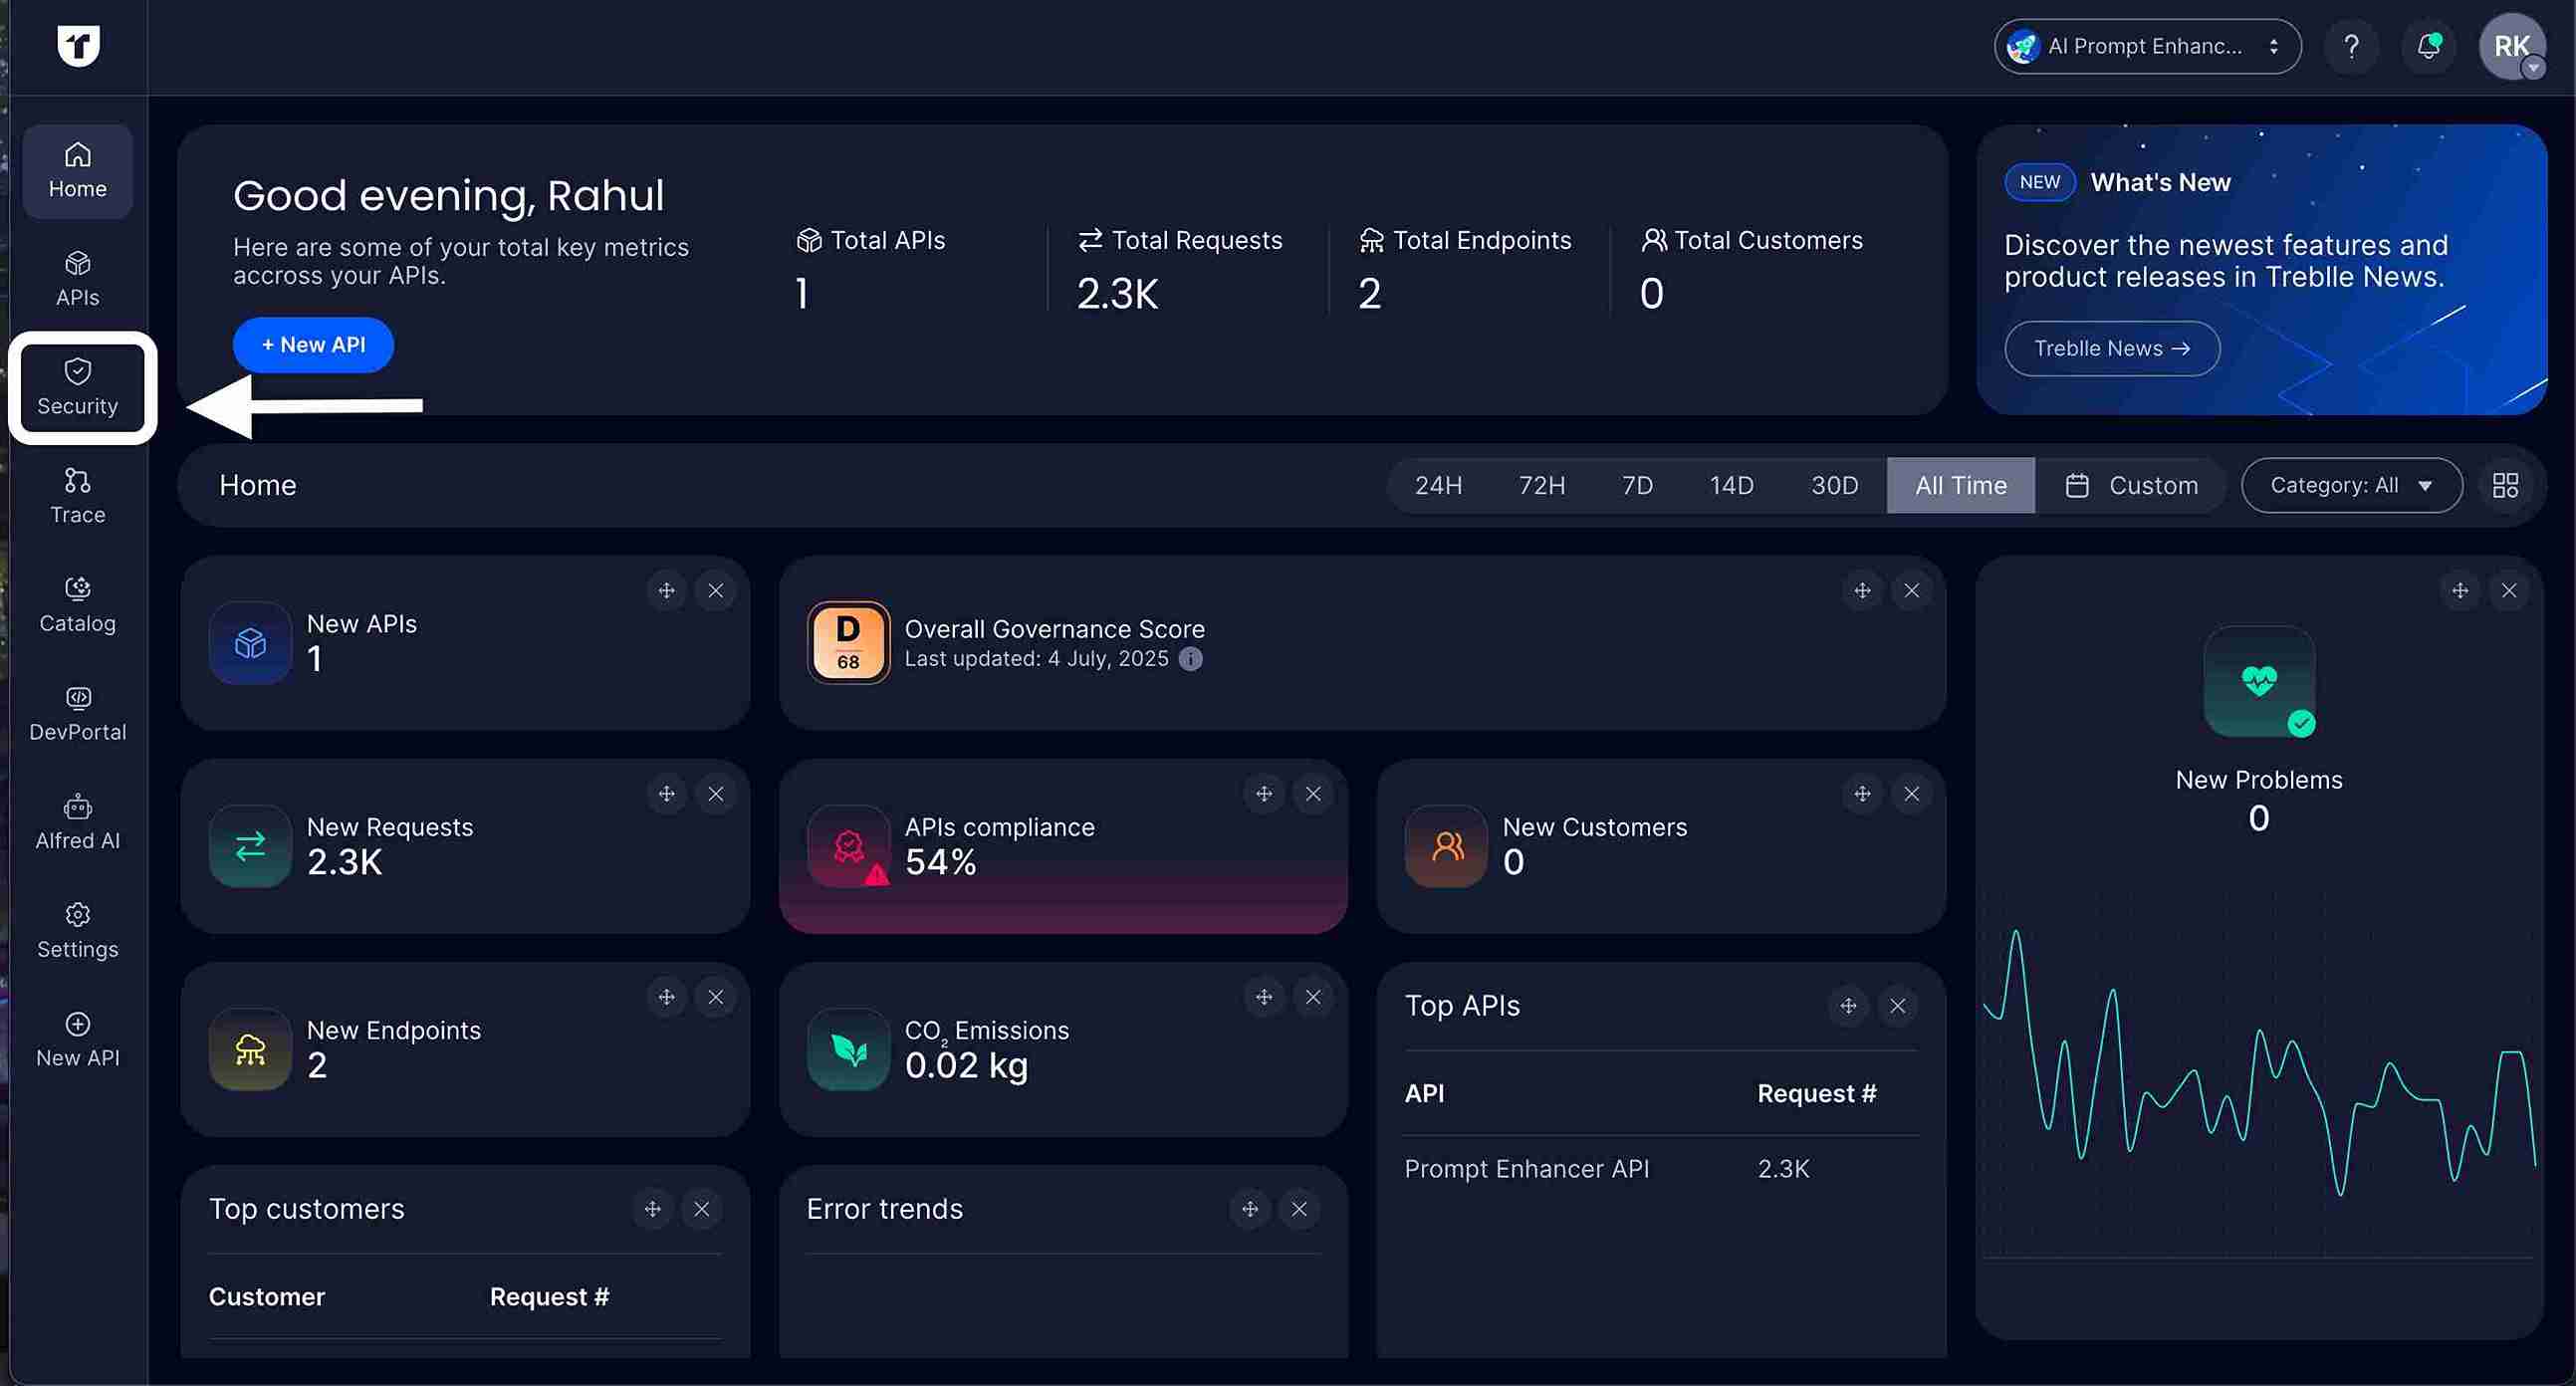
Section titled “Accessing the Security Dashboard”Navigate to Security
Section titled “Navigate to Security”-
Open Workspace Navigation
From the left navigation bar at the workspace level, click on Security.
-
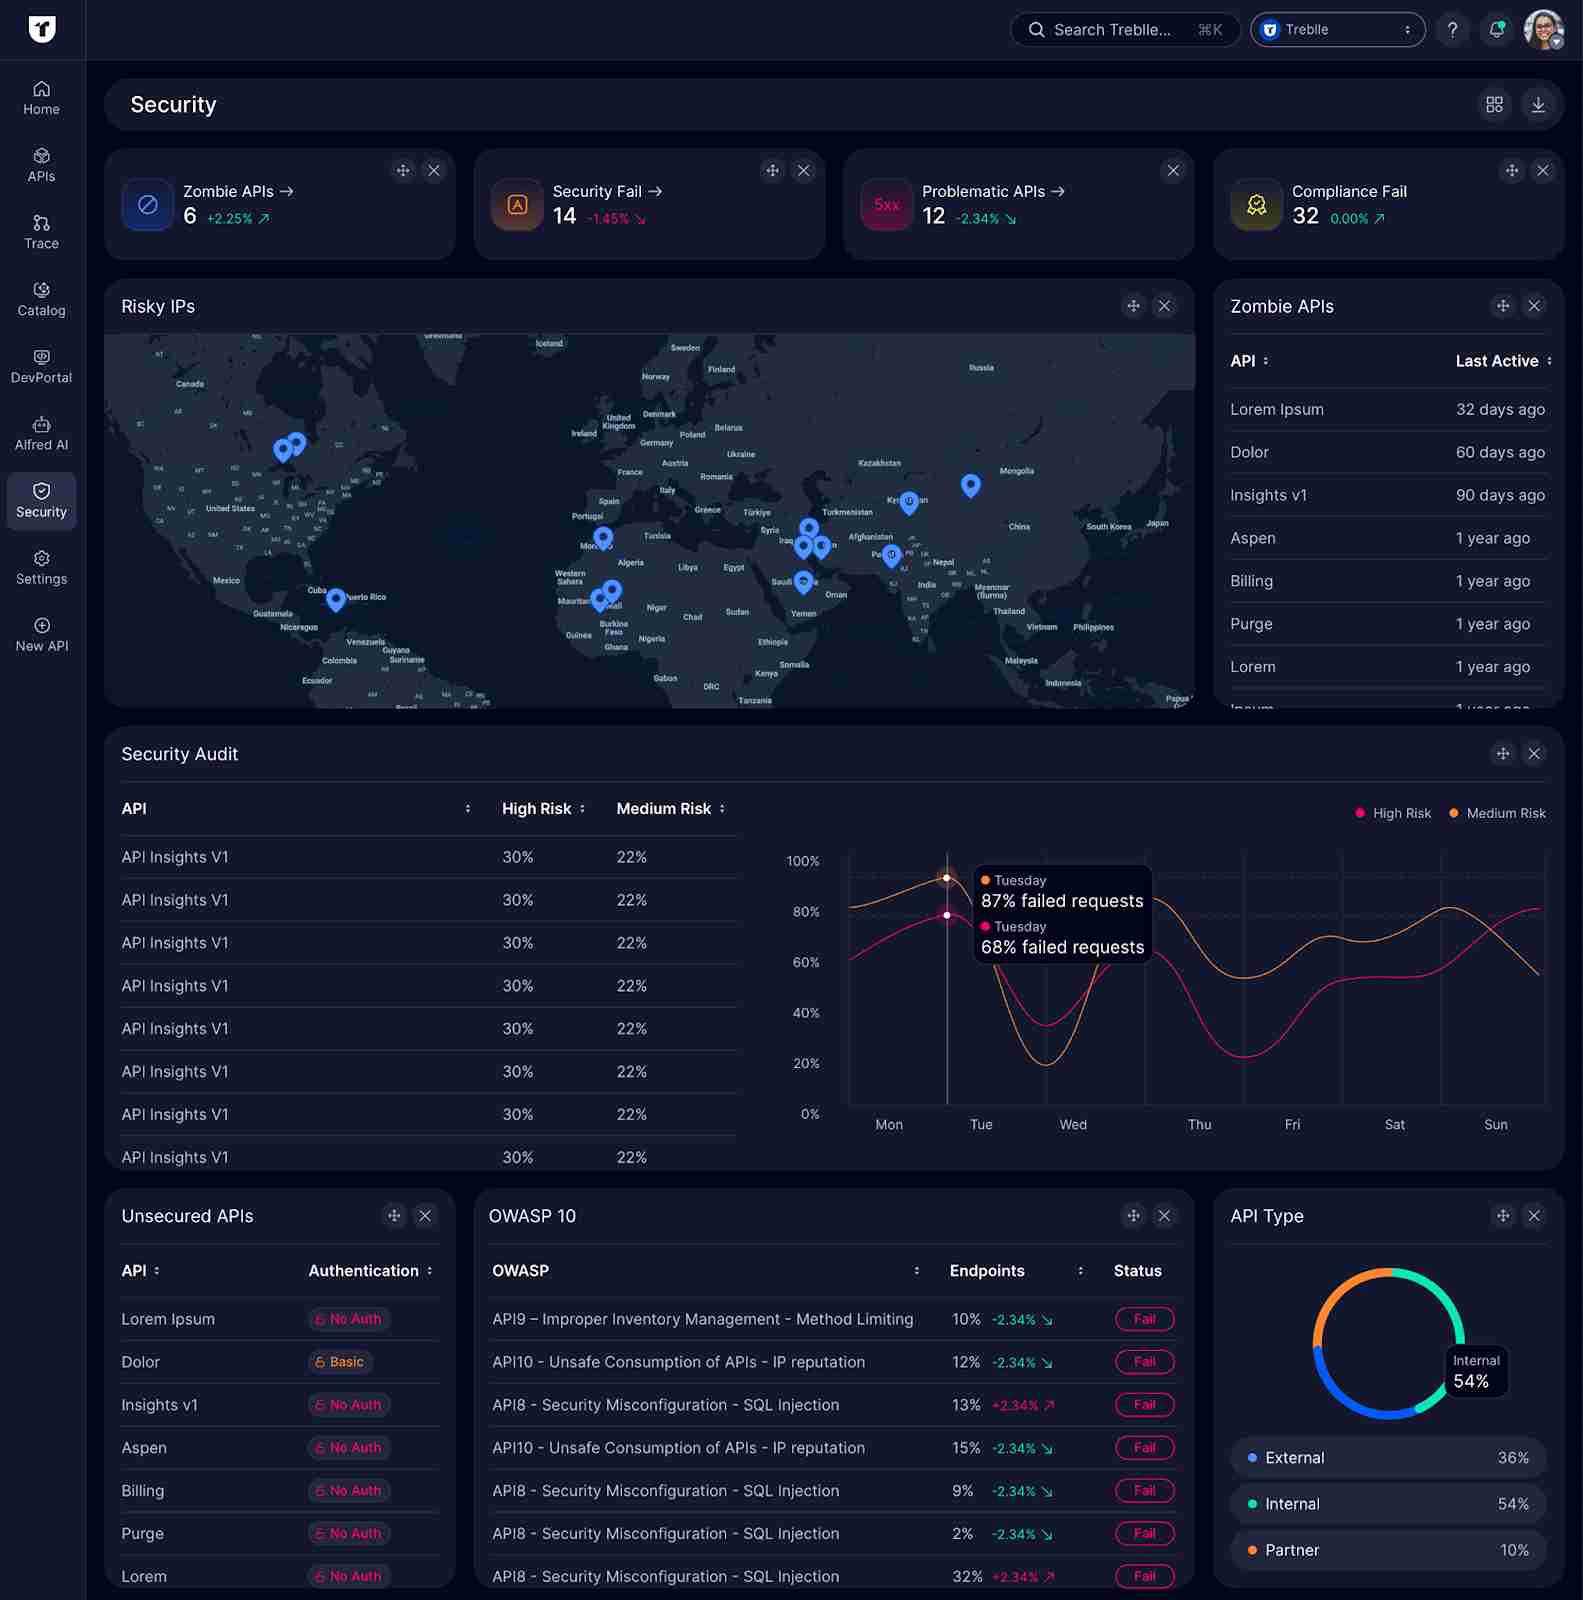
View Security Overview
The Security Dashboard displays an overview of security metrics across all your workspace APIs.
Customizing Your Security Dashboard
Section titled “Customizing Your Security Dashboard”Enable Dashboard Widgets
Section titled “Enable Dashboard Widgets”-
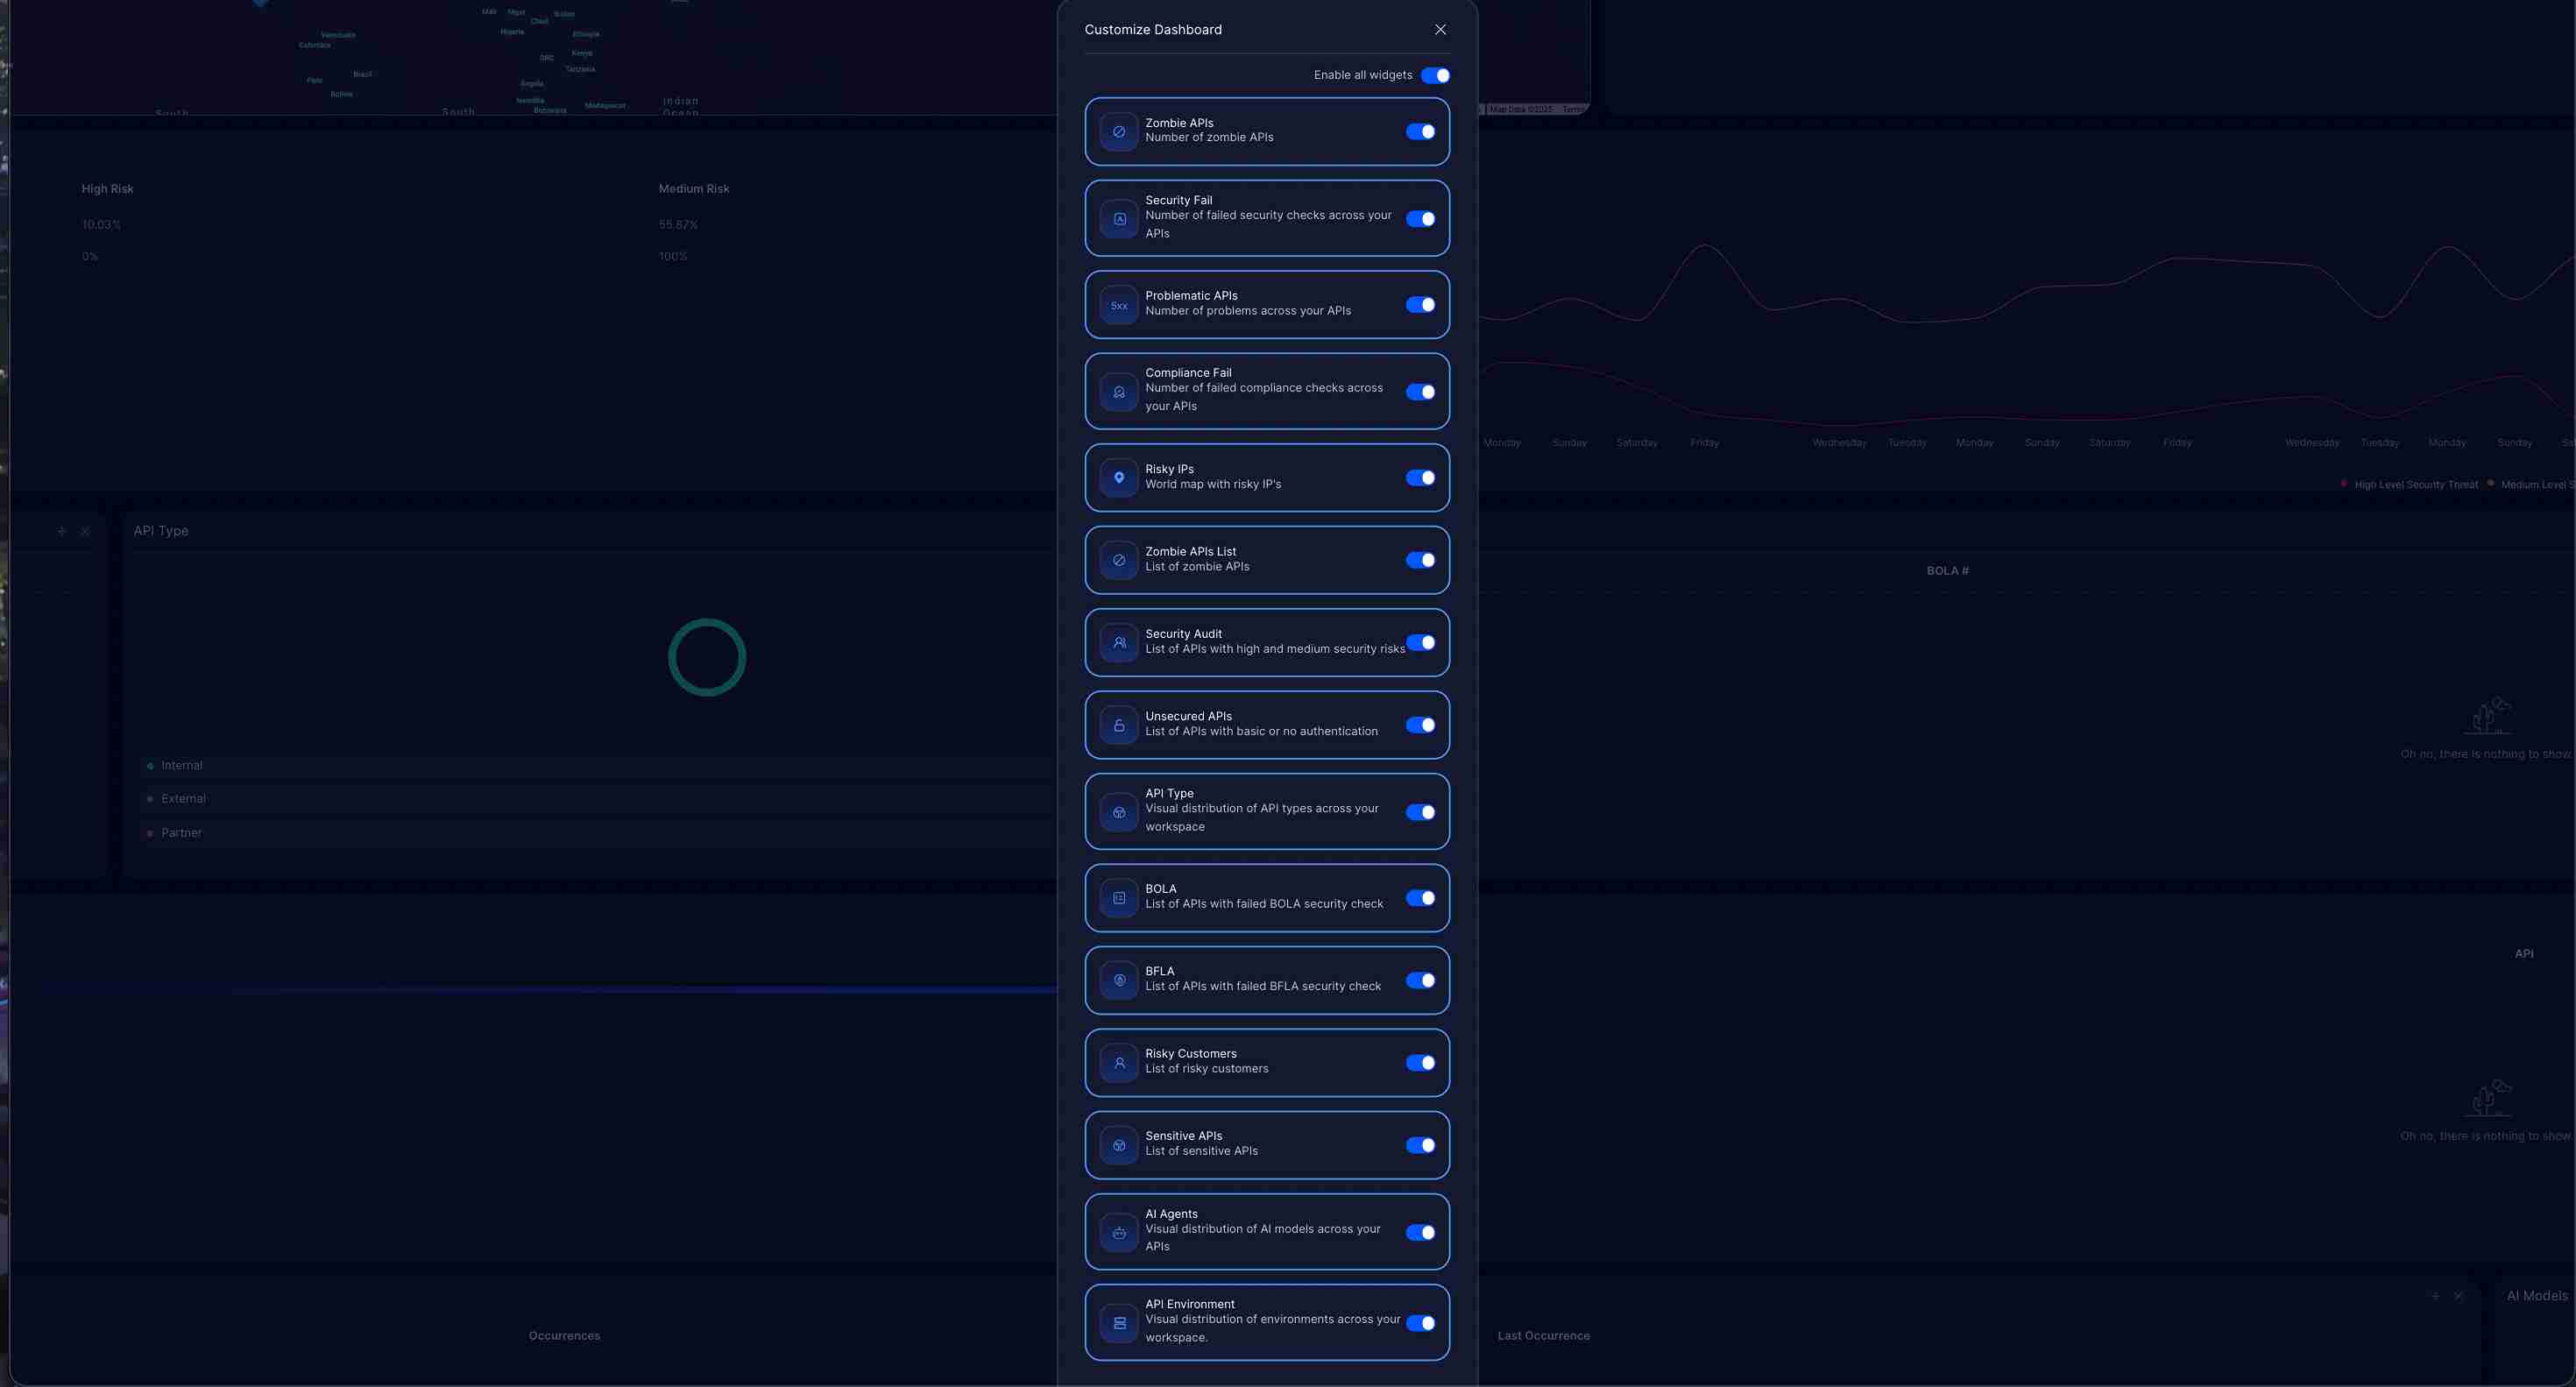
Access Customize Dashboard
Click the grid icon (four squares) in the top-right corner of the Security Dashboard.
-
Widget Selection Panel
A “Customize Dashboard” panel opens with the following options:
- Enable all widgets: Toggle to activate or deactivate all widgets at once
- Individual widget toggles: Select specific widgets to display
-
Choose Your Widgets
Enable the security widgets that align with your monitoring priorities.
-
Save Configuration
Your widget preferences are automatically saved and will persist across sessions.
Security Dashboard Widgets
Section titled “Security Dashboard Widgets”Overview Widgets
Section titled “Overview Widgets”Zombie APIs
Section titled “Zombie APIs”- Description: Number of zombie APIs across your workspace
- What it shows: APIs with endpoints that haven’t received traffic in an extended period
- Why it matters: Zombie endpoints increase attack surface and maintenance burden
- Metric: Total count with percentage change over time
Security Fail
Section titled “Security Fail”- Description: Number of failed security checks across your APIs
- What it shows: APIs failing critical security validations
- Why it matters: Indicates immediate security risks requiring attention
- Metric: Total count with percentage change trend
Problematic APIs
Section titled “Problematic APIs”- Description: Number of APIs with security problems
- What it shows: APIs with detected security issues or vulnerabilities
- Why it matters: Helps prioritize remediation efforts
- Metric: Total count with percentage change indicator
Compliance Fail
Section titled “Compliance Fail”- Description: Number of failed compliance checks across APIs
- What it shows: APIs not meeting regulatory compliance standards
- Why it matters: Essential for maintaining GDPR, PCI DSS, HIPAA compliance
- Metric: Total count with percentage change
Geographic and Network Analysis
Section titled “Geographic and Network Analysis”Risky IPs
Section titled “Risky IPs”-
Description: World map with risky IP locations
-
What it shows: Geographic distribution of requests from IP addresses with poor reputation scores
-
Why it matters: Identifies potential attack sources and geographic threat patterns
-
Visual: Interactive world map with clustered markers
-
Details: Click on markers to see specific IP addresses and locations
Security Audit and Analysis
Section titled “Security Audit and Analysis”Security Audit
Section titled “Security Audit”- Description: API security risk breakdown and trend analysis
- What it shows:
- Table of APIs with High Risk and Medium Risk percentages
- Line graph showing failed request trends over time
- Why it matters: Provides quantitative security metrics for risk assessment
- Metrics:
- High Risk percentage per API
- Medium Risk percentage per API
- Historical trend of failed requests
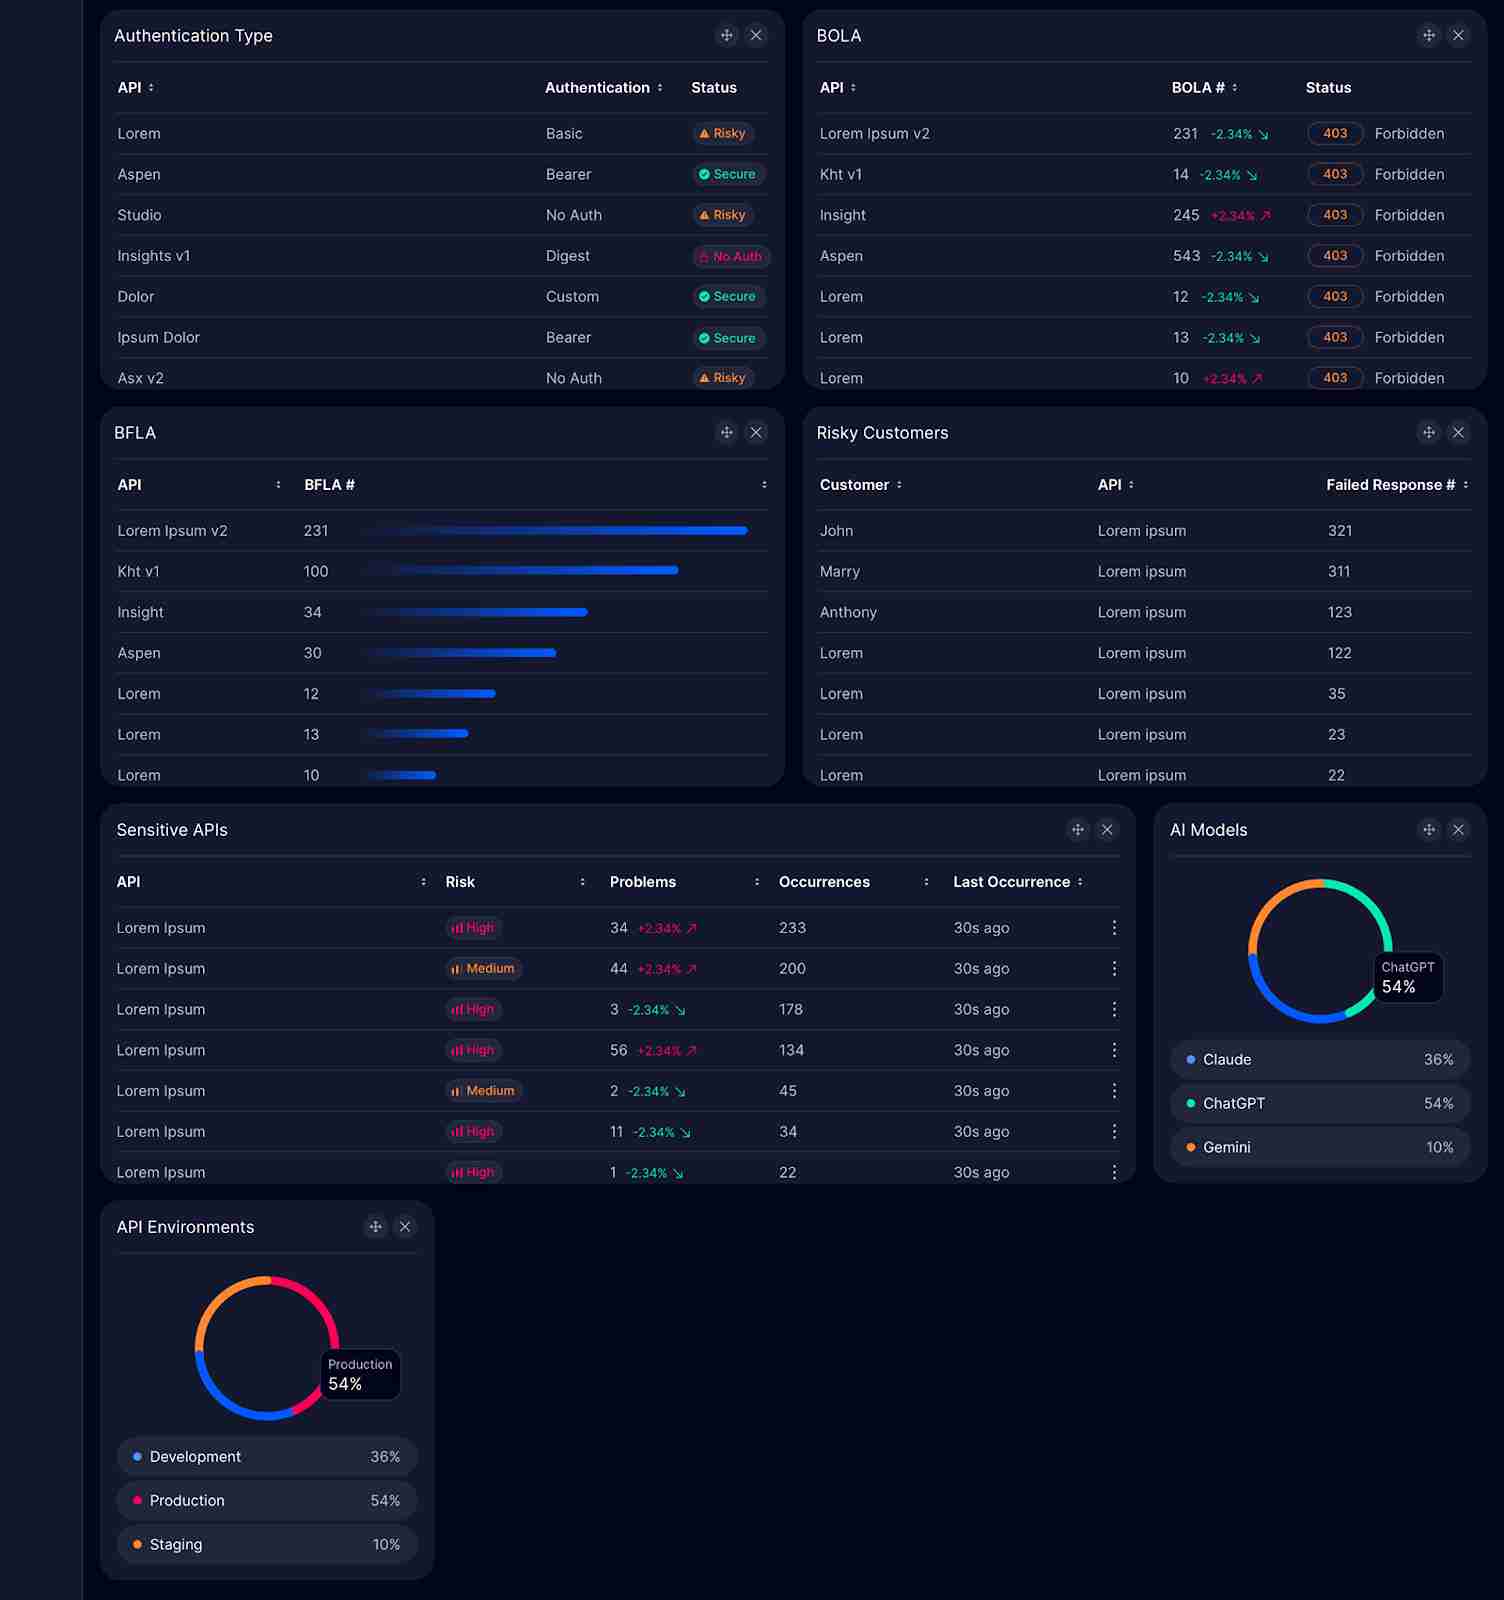
Authentication Type
Section titled “Authentication Type”- Description: List of APIs by authentication method
- What it shows:
- API name
- Authentication method (Basic, Bearer, No Auth, Digest, Custom)
- Security status (Risky, Secure, No Auth)
- Why it matters: Quickly identify APIs with weak or missing authentication
- Risk Indicators:
- Red “Risky”: Weak authentication
- Orange “Risky”: Questionable authentication
- Red “No Auth”: No authentication present
- Green “Secure”: Strong authentication
Unsecured APIs
Section titled “Unsecured APIs”-
Description: List of APIs with no authentication
-
What it shows:
- API name
- Authentication status
-
Why it matters: Critical security gaps requiring immediate attention
-
Indicator: All entries show “No Auth” in red
Vulnerability Analysis
Section titled “Vulnerability Analysis”BOLA (Broken Object Level Authorization)
Section titled “BOLA (Broken Object Level Authorization)”- Description: APIs with BOLA vulnerabilities
- What it shows:
- API name
- BOLA issue count
- HTTP status code (typically 403 Forbidden)
- Visual bar chart of vulnerability distribution
- Why it matters: BOLA is a critical OWASP API Security Top 10 vulnerability
- Metric: Count with percentage change and status indicator
BFLA (Broken Function Level Authorization)
Section titled “BFLA (Broken Function Level Authorization)”- Description: APIs with BFLA vulnerabilities
- What it shows:
- API name
- BFLA issue count
- Visual bar chart showing vulnerability severity
- Why it matters: Function-level authorization issues can expose privileged operations
- Metric: Count with visual severity indication
OWASP 10
Section titled “OWASP 10”- Description: Top 10 OWASP API Security vulnerabilities
- What it shows:
- Specific OWASP vulnerability name
- Number of affected endpoints
- Percentage change trend
- Failure status
- Why it matters: Tracks compliance with OWASP API Security standards
- Examples:
- API9 - Improper Inventory Management - Method Limiting
- API10 - Unsafe Consumption of APIs - IP reputation
- API8 - Security Misconfiguration - SQL Injection
Sensitive APIs
Section titled “Sensitive APIs”- Description: APIs handling sensitive data with security risks
- What it shows:
- API name
- Risk level (High, Medium)
- Number of problems
- Number of occurrences
- Last occurrence timestamp
- Why it matters: High-risk APIs require enhanced monitoring and protection
- Risk Levels:
- Red “High”: Critical security concerns
- Orange “Medium”: Moderate security issues
Customer and Request Analysis
Section titled “Customer and Request Analysis”Risky Customers
Section titled “Risky Customers”- Description: Customers with high failed response rates
- What it shows:
- Customer name
- Associated API
- Failed response count
- Why it matters: Identifies potentially malicious actors or integration issues
- Metric: Failed response count per customer
API Categorization
Section titled “API Categorization”API Type
Section titled “API Type”- Description: Distribution of APIs by type
- What it shows:
- Pie chart visualization
- Percentage breakdown (External, Internal, Partner)
- Why it matters: Different API types have different security requirements
- Categories:
- External APIs: Public-facing endpoints
- Internal APIs: Internal-only services
- Partner APIs: Third-party integrations
API Environments
Section titled “API Environments”- Description: Distribution of APIs by environment
- What it shows:
- Pie chart visualization
- Percentage breakdown (Development, Production, Staging)
- Why it matters: Production APIs require higher security standards
- Environments:
- Production: Live, customer-facing
- Development: Testing and development
- Staging: Pre-production validation
AI Models
Section titled “AI Models”- Description: Distribution of AI model usage across APIs
- What it shows:
- Pie chart visualization
- AI model breakdown (Claude, ChatGPT, Gemini)
- Why it matters: Track AI agent access patterns for security monitoring
- Models Tracked:
- Claude
- ChatGPT
- Gemini
- Other AI services
The Security Dashboard provides comprehensive visibility into your API security posture, enabling proactive threat detection, vulnerability management, and compliance monitoring across your entire API landscape.