Individual API Dashboard
The Individual API Dashboard in Treblle is your command center for managing and understanding a single API, giving you clear visibility into real-time visibility, performance, security, documentation, governance, and a lot more in one place. It not only helps engineering, product, and platform teams but also support, business, and some of the non-technical teams understand how each API is used, who are the customers of a particular API, and what needs improvement.
Individual API Dashboard Overview
The individual API dashboard is a single access point to your API data. It offers a collection of visualizations that you can configure based on your API needs.
- APIs are no more managed in silos, making it easy to understand real usage and issues at the individual API level.
- This dashboard helps you move from guesswork to informed action with real-time insights, governance scoring, and request-level details.
- It enables faster debugging, better product planning, and stronger API security, compliance, and governance.

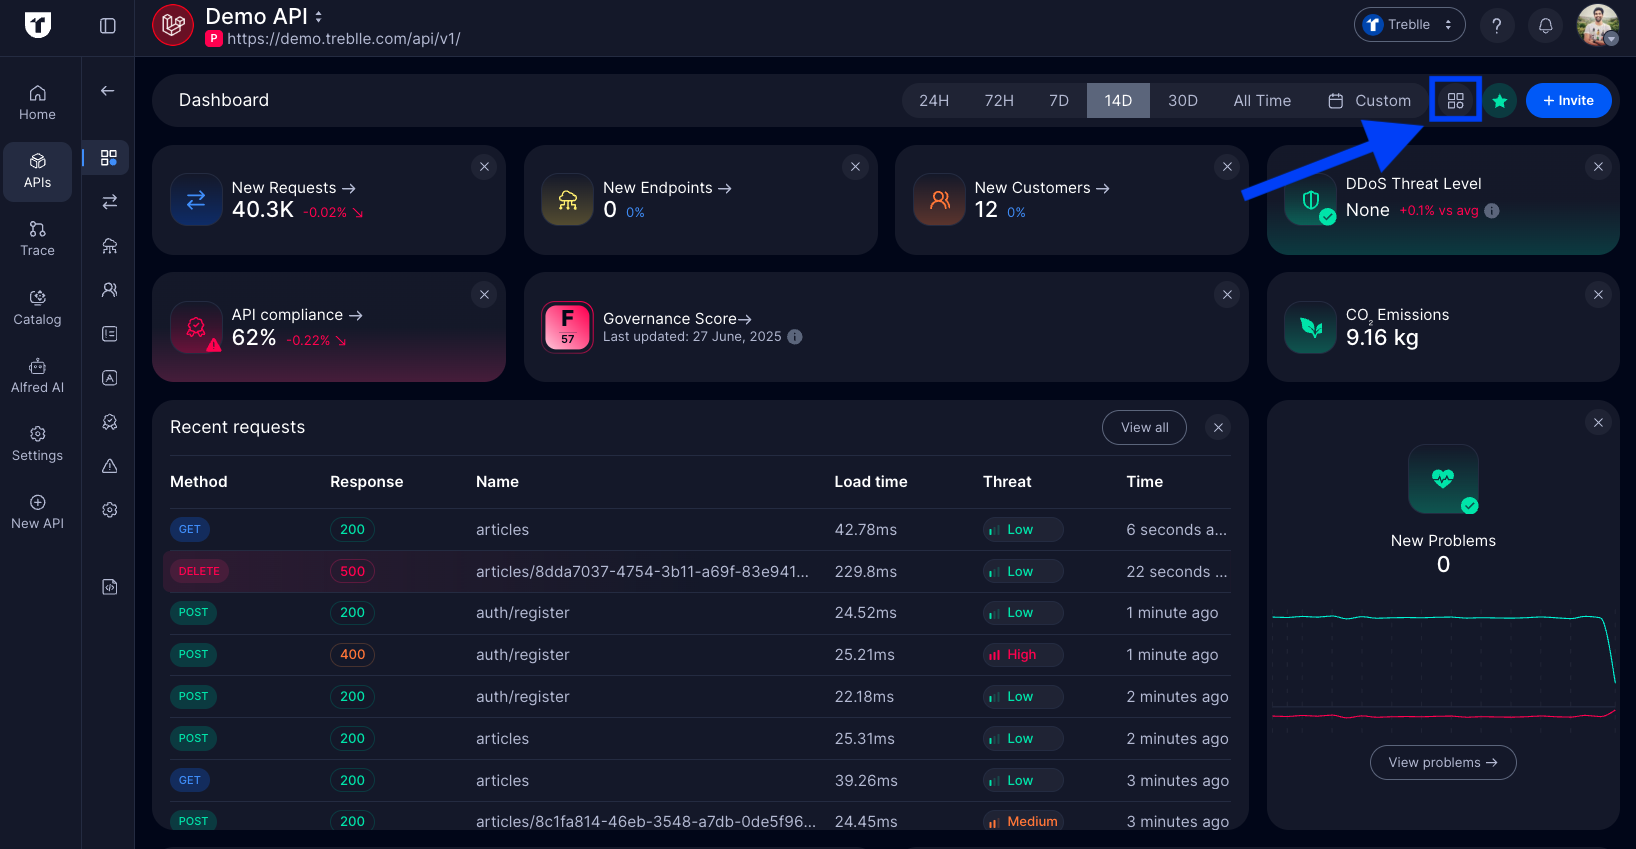
Actions you can take from this page
- Switch between APIs: Use the dropdown on the top bar to navigate between different individual API dashboards.
- Filter by time: Use the time filter (24h, 72h, 7d, 14d, 30d, All Time, or Custom) to adjust your view based on your analysis needs.
- Customize your dashboard:
- Click the grid icon (four squares) to open the Customize Dashboard menu.
- Enable or disable widgets based on what API analytics are important to you.
- Tailor the dashboard to your workflow and save your preferences.
- Navigate to other dashboards: Use the left sidebar to access Requests, Problems, Compliance, Governance, Customers, Docs, and more for deeper workflows.
Key Metrics
At the top of the dashboard are the fundamental metrics that give you an immediate snapshot of your API’s maturity and usage and help you answer questions about the growth and usage of your API.

- Total Requests: Shows the total number of API requests with percentage change
- Total Endpoints: Number of unique API endpoints. It will help you understand your API’s scope
- Total Customers: Helps understand how many new customers/ API consumers ahve been onboarded onto your API
- API Compliance: Overall API compliance posture to constantly observe if your API follows regulatory standards across GDPR, PCI DSS< and more
- API Governance Score: Treblle provides a Governance Score that acts as a standard metric to compare all your APIs and have a baseline understanding of how well your API is designed, secured, maintained, and performing.
- Recent Requests section is a live feed of the most recent API requests showing the HTTP Method, Response Status, Endpoint Name, Load Time, Threat Level, and Timestamp. Clicking on any request in the recent requests list opens a detailed view of that request, showing complete request and response data.
When you’re ready to investigate or drill down into any of these key metrics, yoyu have dedicated views and more details that make it up, you can head over to the necessary section from the left-side navbar.
Full List of Customizable Widgets
Treblle lets you customize your Individual API Dashboard so you see the metrics that matter most for your role and workflow.
- If you’re a Product Manager, you might focus on users, top locations, usage trends, client app versions, and customer behavior to inform adoption and roadmap decisions.
- If you’re a Backend Engineer or DevOps person, you might include performance charts, response sizes, load times, security audits, and error monitoring to debug and optimize your API.
- If you’re a Technical or Business Leader, you might use a combination of customer usage and security posture to align API health with business outcomes.
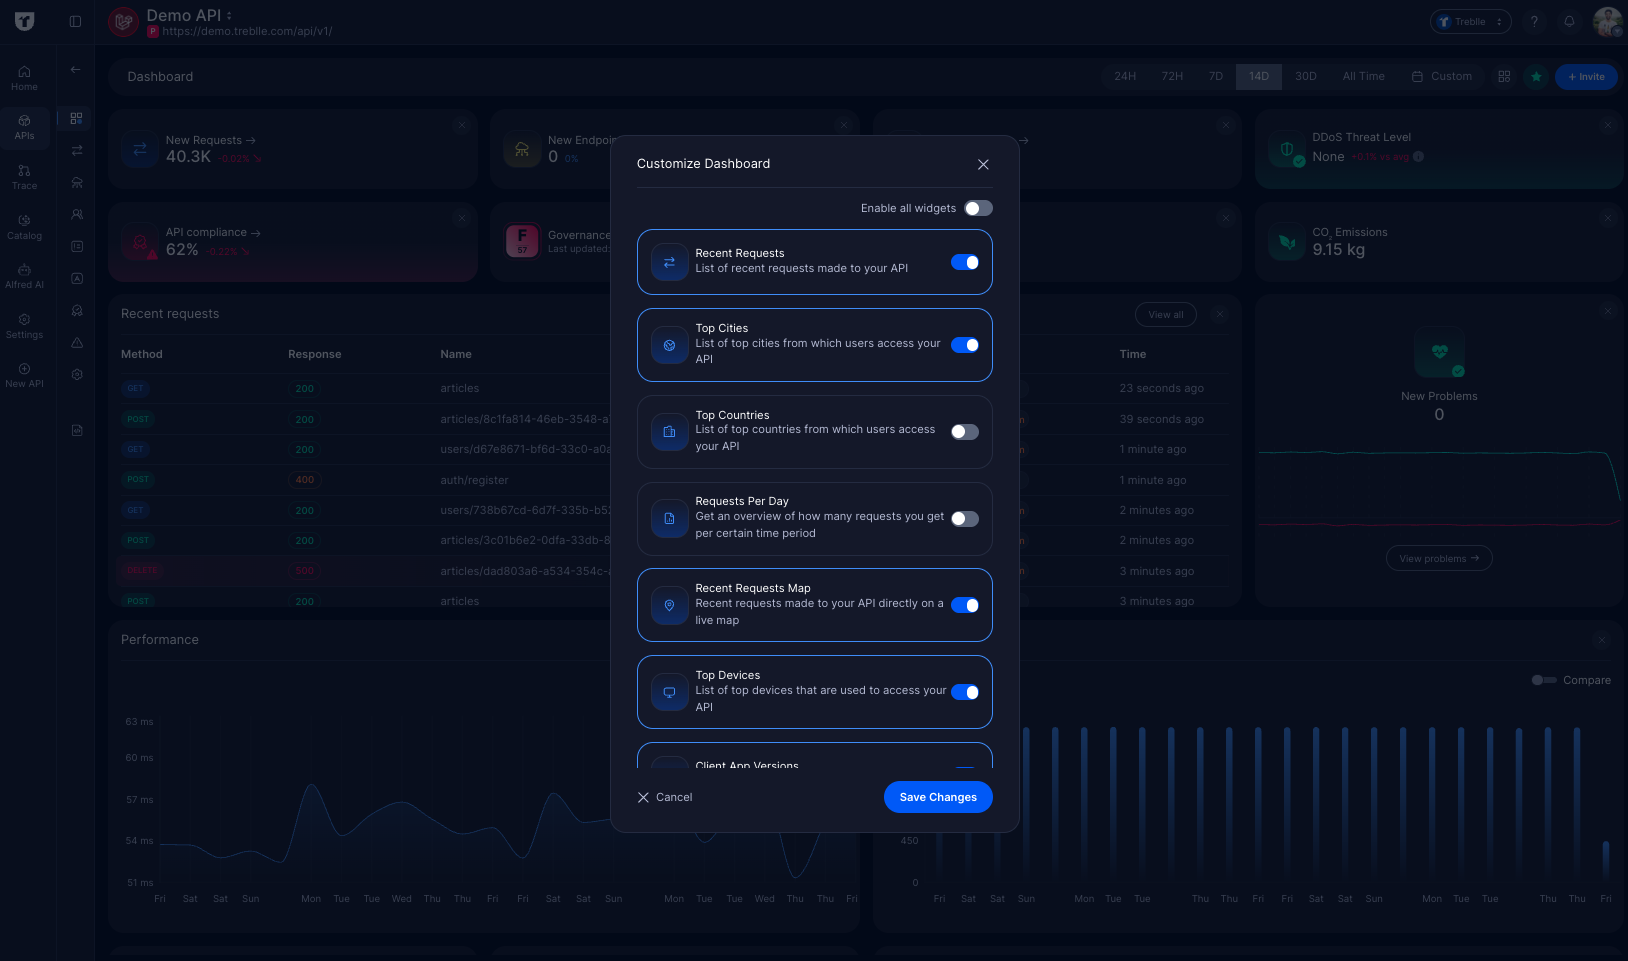
You can enable or disable the following widgets on your dashboard:
- Total Customers: Track how many unique customers use your API.
- CO2 Emissions: Measure the CO2 footprint of your API traffic.
- Risky IPs: View IP addresses with high or medium risk scores.
- Security Headers: Percentage of requests failing security header checks.
- Denial of Service: Monitor DDoS threat levels in real-time.
- Security Audit: Requests failing critical/high/medium security checks.
- SQL Injection: Requests passing or failing SQL injection checks.
- Top Questions: Questions users ask Alfred AI about your API.
- Problems Heartbeat: API health trends over time.
- Total Requests: Total requests within your chosen period.
- Total Endpoints: Count of endpoints in your API.
- Compliance: Your API’s compliance percentage.
- Governance: Governance score for your API.
- Client App Versions: App versions accessing your API.
- Average Load Time: Average load time of API requests.
- Average Response Size: Average size of responses.
- Performance Per Day: Daily load time trends.
- Top Customers: Customers generating the most traffic.
- Recent Questions: Latest questions about your API.
- Recent Requests: Most recent requests to your API.
- Top Cities: Cities where requests originate.
- Top Countries: Countries where requests originate.
- Requests Per Day: Daily request volume.
- Recent Requests Map: Live map of incoming requests.
- Top Devices: Devices accessing your API.
Time Windows and Comparisons
Whether investigating a recent incident or preparing a monthly performance report, having the correct time context is essential.
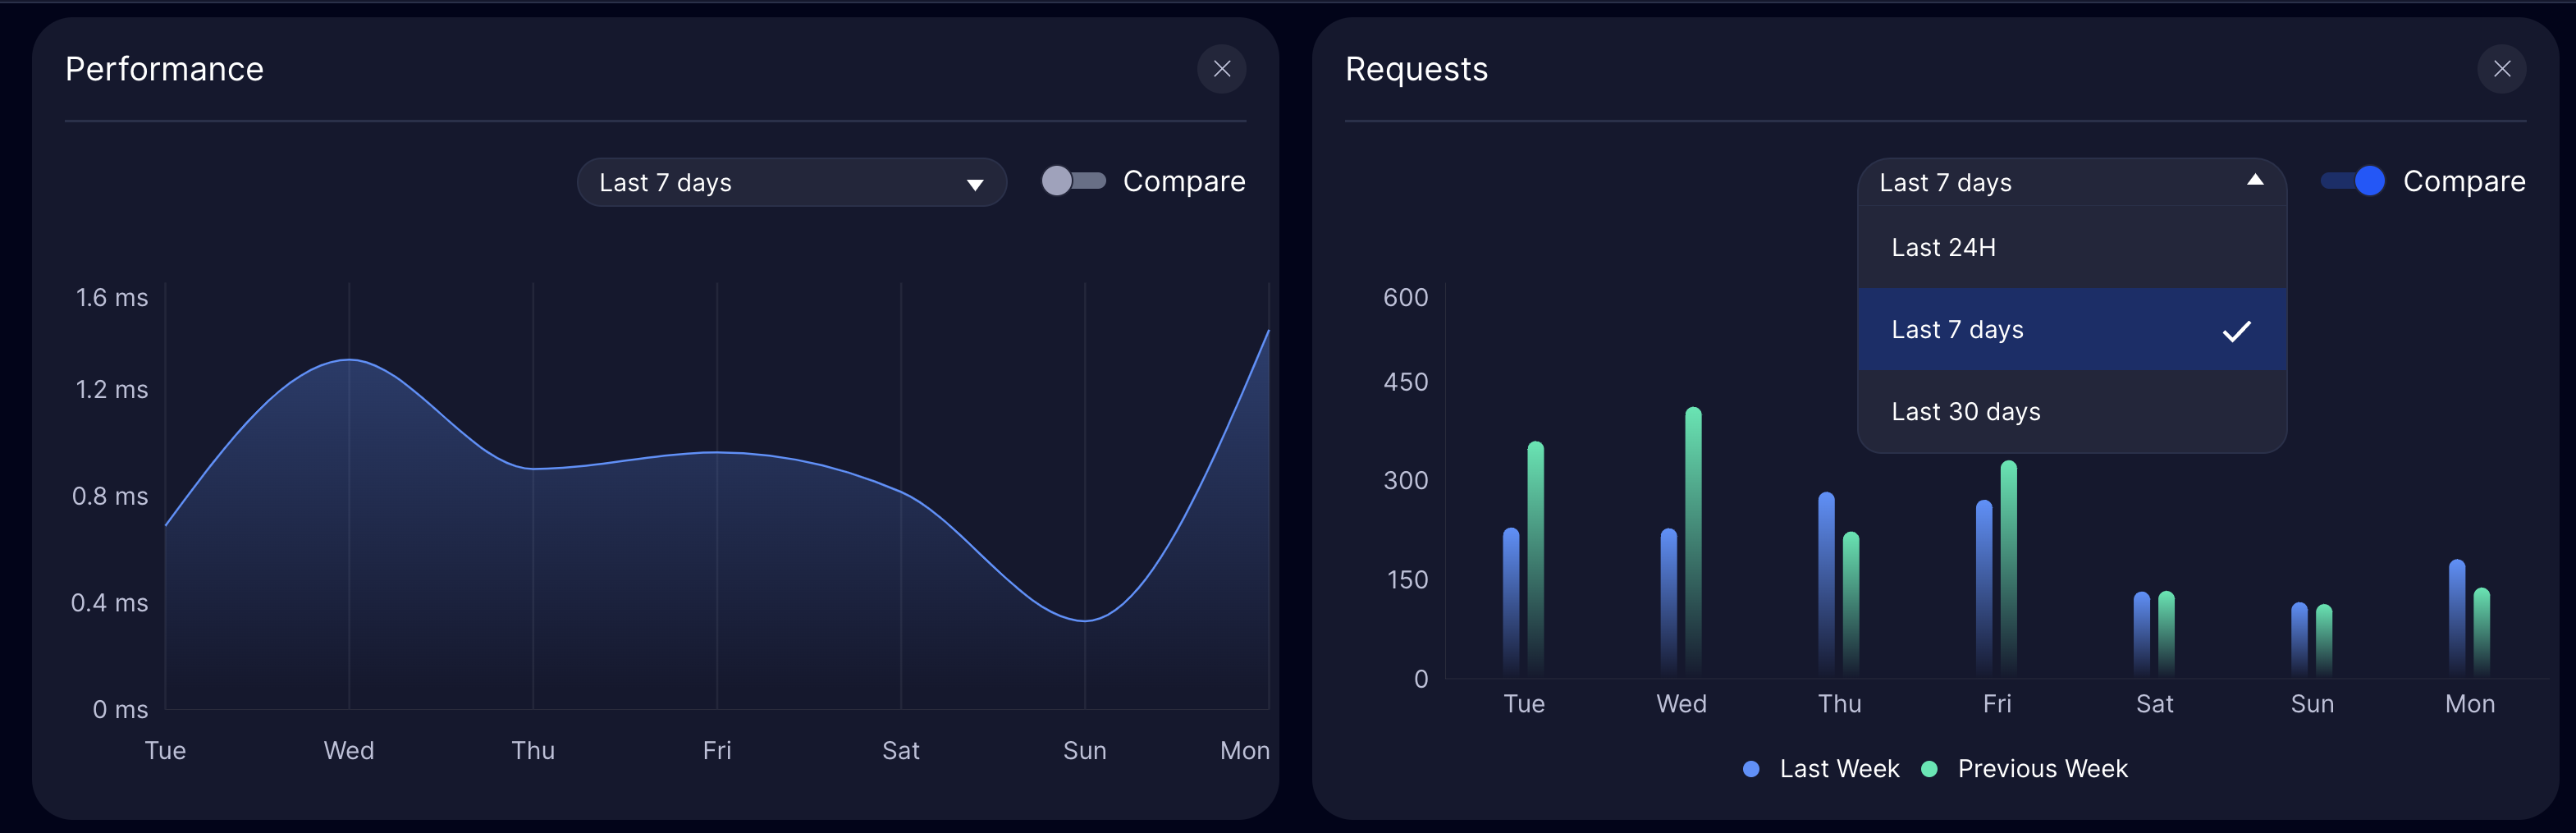
For example, if you notice a sudden spike in response times, you can quickly compare it with the previous period to determine if this is a new issue or a recurring pattern. This becomes particularly valuable when:
- Debugging performance issues reported by customers
- Planning infrastructure scaling based on usage patterns
- Preparing reports for stakeholders
- Monitoring the impact of recent API changes
Choose from three time windows to view your API data:
- Last 24 hours: Perfect for spotting immediate issues and monitoring day-to-day operations
- Last 7 days: Ideal for identifying weekly patterns and recent trends
- Last 30 days: Great for monthly reporting and long-term trend analysis
- All Time: Useful for reviewing the complete API history and long-term baselines.
- Custom: Allows focused analysis on specific incidents, campaigns, or timeframes relevant to your business.
Toggle the Compare option on any graph to see how your current metrics stack up against previous periods. It’s a quick way to track progress, spot improvements, or catch issues before they grow.